See every Mac.
Miss nothing.
Lightweight macOS endpoint telemetry. Uploads straight to Splunk or view it locally on the native dashboard.
![]() Built with native Swift & SwiftUI — lightweight, fast, and privacy-focused
Built with native Swift & SwiftUI — lightweight, fast, and privacy-focused

Click to expand


Telemetry
See the data, not a score.
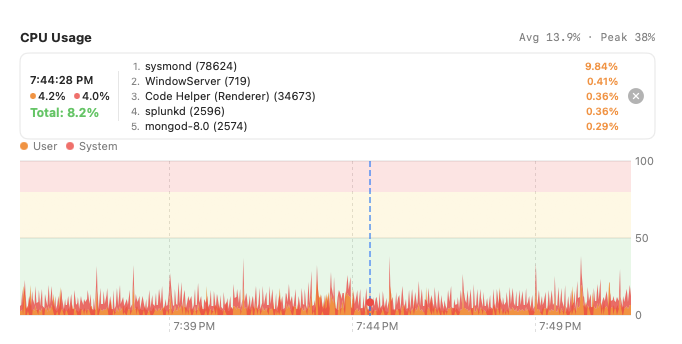
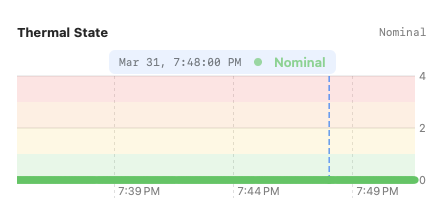
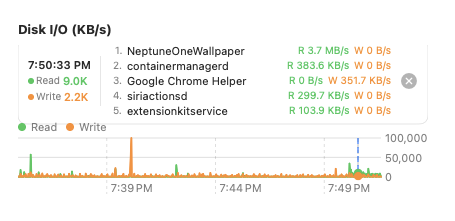
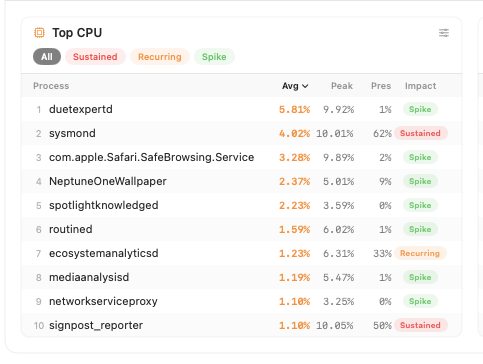
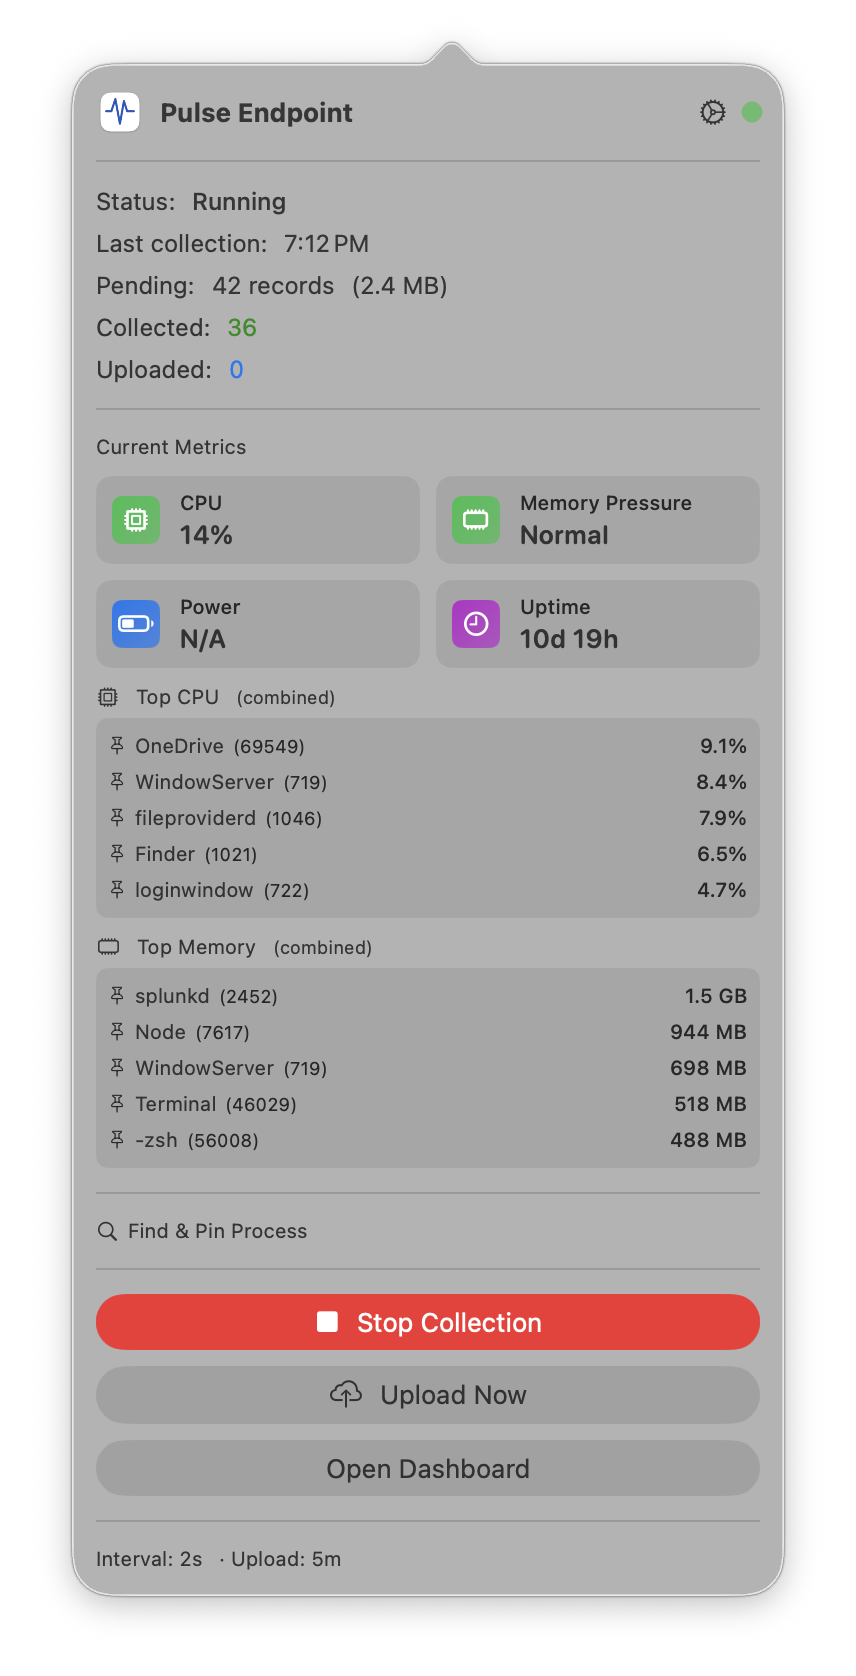
The details your DEX doesn't show you. Eight collectors capture per-process CPU and memory, thermal throttling, memory pressure, GPU load, disk I/O, network activity, and power state — on a configurable interval using native macOS APIs.

Deployment
Push the signed installer via Jamf, Mosyle, Kandji, or Munki. Drop a config profile for your Splunk endpoint and collection interval. Done.
40+ configurable parameters via MDM profiles
Deploy & Forget
Users never see it.
Runs headless with zero end-user disruption. Need local visibility? Flip one key to enable the menu bar UI.
Full MDM Integration
Manage from your desk.
Start, stop, and configure every Mac from your MDM console or Remote Desktop. No end-user interaction.
Splunk Ready
Data where you need it.
Uploads directly to Splunk HEC. If the network drops, data queues locally and syncs when it's back. Nothing is lost.
Watched Processes
Sometimes you need to know which app is spiking CPU or pressuring memory.
Pin specific apps from the menu bar, a config profile, or the CLI. Pulse tracks their CPU, memory, and disk usage per-process — so you know exactly which machines are running what, and how much it costs.

See what your fleet is actually doing.
Pulse Endpoint is in beta. Join now if you manage Macs and want early access.